Where we are and have been:
It is hard to believe we are in another election year. It feels like this election cycle is presenting the greatest level of uncertainty than ever before, so we wanted to provide insight regarding the largest factors that influence performance. Before we delve into that, we wanted to share the recent and long-term performance of the S&P 500 and the relationship between consumer confidence and stock market performance.
Even with inflation becoming problematic since the last inauguration in Jan 2021, the 3 Year Annualized Performance of the S&P 500 has been 9.92%. The index has returned an annualized average return of 10.26% since its 1957 inception through the end of 2023. The point in sharing this is while the last three plus years have felt extraordinary in some respects, they have been quite ordinary from a stock market perspective.
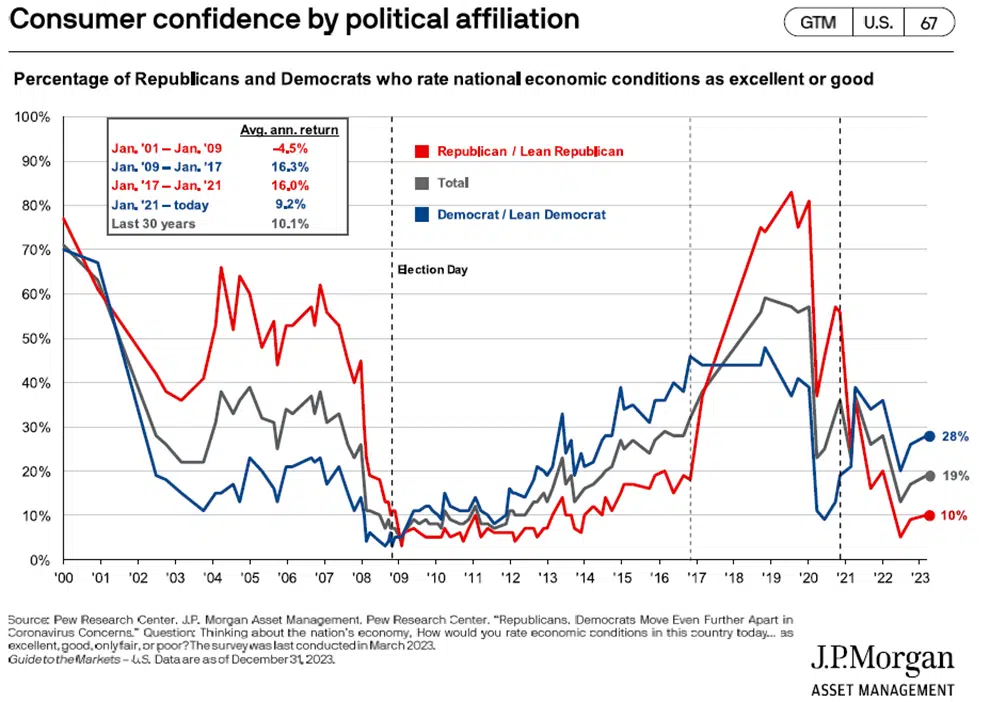
Historically, there has been a lack of correlation between consumer confidence and stock market performance. For example, during the Bush term (Jan 2001 to Jan 2009), confidence was high even though the average annual return was (4.5%) with the Nasdaq bubble bursting the first part of the decade and Global Financial Crisis at the end. During the Obama term (Jan 2009 to Jan 2017), confidence was low even though the average annual return was 16.3%. There were long lasting negative impacts from the gravity of the Financial Crisis that it took until 2013, four plus years into the recovery for the consumer to feel more optimistic. See Chart Below:

The performance of the stock market during election years can be influenced by a variety of factors, including economic conditions, policy expectations, and geopolitical events. It is essential to note that the stock market is complex, and its movements are not solely determined by election cycles. However, some patterns and trends have been observed historically:
- Market Volatility:
- Election years often witness increased market volatility. Uncertainty about potential policy changes and the direction of economic policies can lead to fluctuations in stock prices.
- Pre-Election Jitters:
- In the months leading up to an election, markets may experience increased uncertainty as investors try to assess the potential impact of different candidates’ policies on the economy and corporate profits.
- Post-Election Rally or Correction:
- The stock market’s reaction after the election can vary. There is a historical tendency for a post-election rally, especially if the election results provide clarity and reduce uncertainty. However, this is not a guaranteed outcome, and market corrections can also occur.
- Policy Expectations:
- The market tends to react to policy changes and economic initiatives proposed by the incoming administration. For example, sectors such as healthcare, technology, and infrastructure may be influenced by policy discussions and potential legislative changes.
- Economic Fundamentals:
- Economic conditions, corporate earnings, and global events also play significant roles in shaping market trends during election years. Economic data, such as GDP growth, employment figures, and inflation rates, can impact investor sentiment.
- Geopolitical Factors:
- Geopolitical events and global economic conditions can influence market behavior during election years. Trade tensions, international conflicts, or major geopolitical developments may impact investor confidence.
It is important to approach the analysis of stock market performance during election years with caution. While historical trends can provide some insights, each election year is unique, and various unforeseen events can impact market dynamics. Additionally, market participants’ reactions to political events can be unpredictable, and investment decisions should be based on a comprehensive understanding of economic and market fundamentals.


